


- CDN (always latest):
<link rel="stylesheet" href="https://cdn.jsdelivr.net/npm/@ajdeb/blocks-ui@latest/blocks.min.css">
<script src="https://cdn.jsdelivr.net/npm/@ajdeb/blocks-ui@latest/blocks.min.js"></script>
For production, pin a specific version:
<link rel="stylesheet" href="https://cdn.jsdelivr.net/npm/@ajdeb/blocks-ui@1.0.0/blocks.min.css">
<script src="https://cdn.jsdelivr.net/npm/@ajdeb/blocks-ui@1.0.0/blocks.min.js"></script>- Download the
blocks.min.cssandblocks.jsfiles from the releases locally and import them directly:
<link rel="stylesheet" href="./path_to_static/blocks.min.css">
<script src="./path_to_static/blocks.min.js"></script><html>
<!-- See above for imports in the <head> -->
<body>
<div class="blockrow">
<div class="block-100">
<div class="title-lg">Blocks UI</div>
<div class="subtitle">Status: live</div>
</div>
</div>
<div class="blockrow">
<div class="block-lg-20 block-md-40">
<div class="title">Latest price</div>
<div class="subtitle">Last updated: 5 min ago
</div>
<div class="number">$3,600</div>
<div class="footer">Source: NYSE</div>
</div>
<div class="block-lg-20 block-md-40">
<div class="title">Volatility</div>
<div class="subtitle">Last updated: 5 min ago</div>
<div class="number">67%</div>
</div>
<div class="block-lg-60 block-md-100 tab-block">
<div class="tabs">
<a href="#tab1" class="tab active">News</a>
<a href="#tab2" class="tab">Futures</a>
</div>
<div id="tab1" class="tab-content">
<p>NYSE just put out a notice that the ticker $BLOCKS will start trading next week.</p>
<div class="footer">Source: BBG</div>
</div>
<div id="tab2" class="tab-content">
<table>
<thead>
<tr>
<th scope="col">BLOCKS</th>
<th scope="col">HNEWS</th>
<th scope="col">GITHUB</th>
<th scope="col">HSC</th>
</tr>
</thead>
<tbody>
<tr>
<th scope="row">+5%</th>
<th>+4%</th>
<th>-5%</th>
<th>+12%</th>
</tr>
</tbody>
</table>
</div>
</div>
</div>
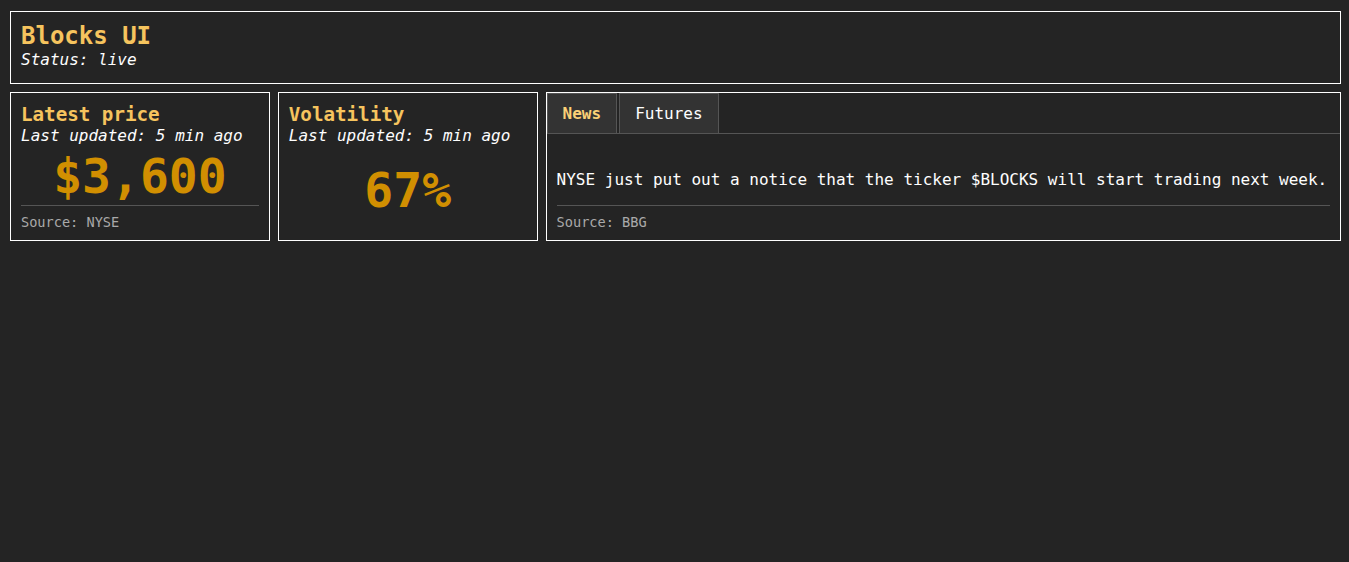
</html>This will create a simple blocks UI:
There is simply no library today that is a light CSS/JS library that can help with the visualization of data. There are many frameworks today that can display beautiful dashboards, but they are either bloated, slow or simply not data specific.
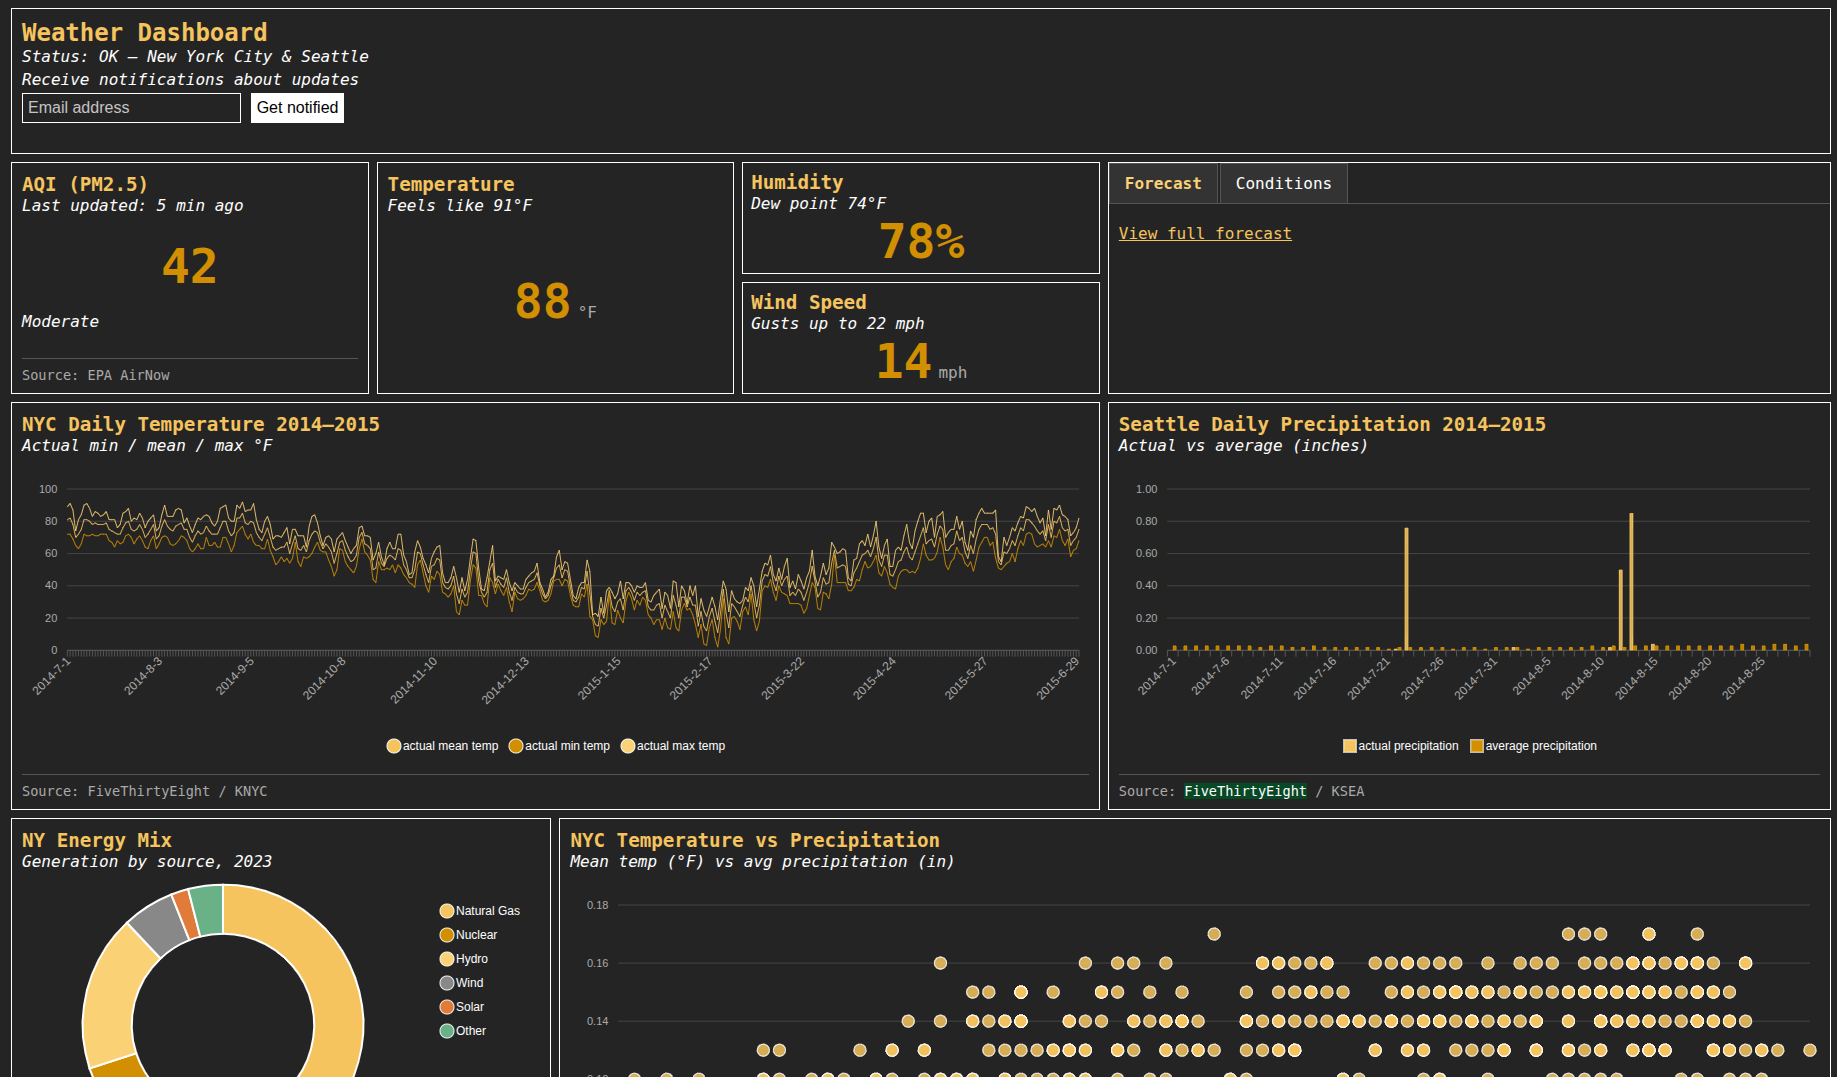
Blocks UI allows you to display your data is different blocks. Each block has:
- A title
- A subtitle (optional)
- Tabs (optional)
- A body
- A footer (optional)
A block body can contain:
- Another block
- Text
- A chart
- A number
- Plain HTML
- Display individual metrics
- Display tables / heatmaps
- Display charts
- Display maps (coming soon)
- Display card lists
- Display your custom HTML
- Load data directly in your script (SSR) or via an API (JSON or CSV for now)
- Add a navbar and a side menu
- Add API healthchecks
This library was originally built by hand, and I've recently picked it back up and use some LLM tools to help me move it along at a faster pace. All reviews are manual, but please use carefully.